Give the board a risk picture it can act on

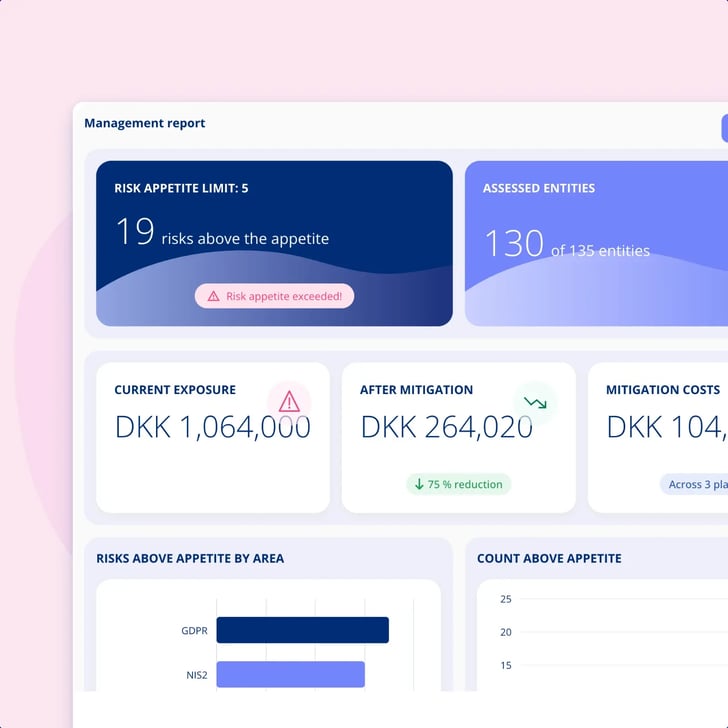
One management report across every risk area: how many entities have been assessed, how many risks sit above appetite, what the exposure is now and once the open plans are done, and what those plans cost. Export it with your own comment on it, so the figures reach the board with your reading of them attached.

Unlimited users  •  Free onboarding and support  •  No commitment

Illustration of a report panel carrying a bar chart and a trend line, with a comment bubble attached to it and three figures waiting at a table beside it
+400 companies use .legal
Region Sjælland
Aarhus Universitet
aj_vaccines_logo
Realdania
Right People
IO Gates
PLO
Finans Danmark
geia-food
Evida
Klasselotteriet
NRGI1
BLUE WATER SHIPPING
Karnov
Ingvard Christensen
VP Securities
AH Industries
Lægeforeningen
InMobile
AK Nygart
DEIF
DMJX
Axel logo
qUINT Logo
KAUFMANN (1)
SMILfonden-logo
kurhotel_skodsborg
nemlig.com
Molecule Consultancy
Novicell
The management report in .legal: 19 risks above an appetite limit of 5 with an appetite-exceeded warning, 130 of 135 entities assessed, and three figures side by side for exposure now, exposure once the plans are done at a 75 per cent reduction, and what those plans cost

Risk reporting to the board Meridian's board material stopped being assembled by hand

Lars Bang is COO at Meridian Nordic and the executive sponsor for compliance. Maria Holm runs the risk areas across the group, GDPR, NIS2 and information security, each with its own scale and its own appetite. The numbers used to be collected out of three separate workbooks the week before a board meeting, and the person presenting them was rarely the person who made them. Now one management report brings the areas together against a single global risk appetite, Maria exports it with her own comment on it, and Lars takes one artefact into the meeting.

  • One report across every risk area, measured against a single global risk appetite.
  • Financial exposure now, exposure once the open mitigation plans are done, and what those plans cost.
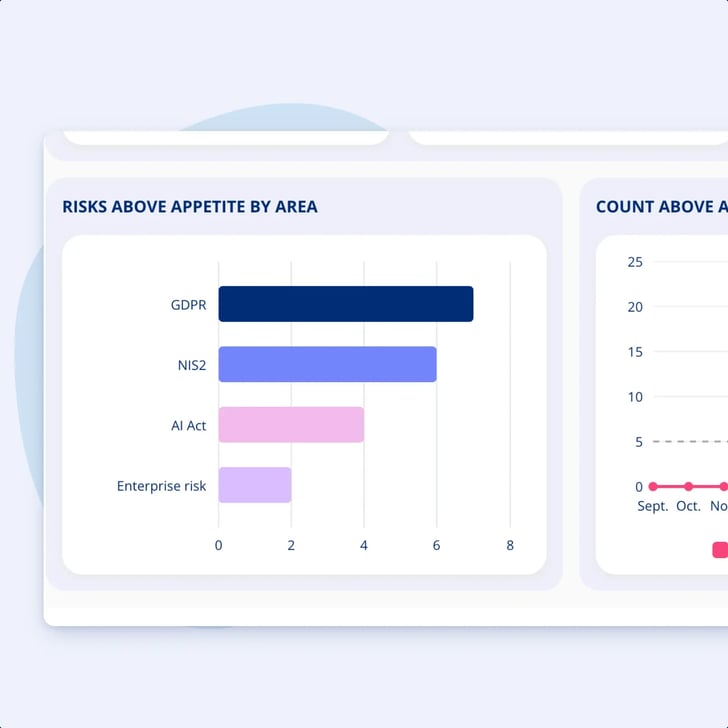
  • A breakdown by area, so the meeting goes to the two areas under pressure instead of touring all of them.
  • The export carries the risk owner's own comment, so the figures arrive with the framing attached.

  • Exposure, in money

    Financial exposure as it stands, exposure once the open mitigation plans are done, and what those plans are expected to cost.

  • Your comment travels with it

    The report exports, and you insert a comment as part of the export, so nobody has to explain the numbers in a separate email.

  • Appetite against actual

    How many entities have been assessed, and how many risks sit above appetite, measured against one global risk appetite.

  • A direction, not a snapshot

    A trend over time shows whether the picture is improving, and a breakdown by area shows where the pressure comes from.

Illustration of one figure standing on a large grid surrounded by more scattered grids, while a second figure stands apart holding a single clean summary card

Risk reporting to the board The board doesn't get the matrix

Risk assessment produces a lot of working material: entities, scenarios, consequence and probability, a justification on each. Almost none of it belongs in a board meeting.
  • A spreadsheet per risk area, each living its own life, and nothing that adds them up in the room.
  • The matrix is the right tool for the person doing the assessment and the wrong one for the person approving the spend.
  • Material assembled by hand the week before is already behind the moment something is reassessed.
The lower half of the management report: a bar chart of risks above appetite by area with GDPR highest, then NIS2, the AI Act and enterprise risk, beside a chart counting risks above appetite month by month against a dashed target line

Risk reporting to the board One report across every risk area

Where several risk areas are in play, the management report brings the numbers together and measures them against one global risk appetite, which is how many risks in total may exceed appetite before management has to act.

  • How many entities have been assessed, which answers whether the work is being done at all.
  • How many risks currently sit above appetite, across areas that each run on their own scale.
  • A breakdown by area and a trend over time, so the picture has a direction and not just a level.
Illustration of a report card travelling along a rail with a comment bubble pinned to it and a colleague receiving it at the far end, while an empty envelope drifts away unused

Risk reporting to the board The comment is the part that travels

A report that leaves the platform as bare figures gets explained in a separate email, and then the email and the figures live apart. Here the person exporting the report inserts a comment as part of the export.
  • The framing sits on the figures themselves, written by the person who understands them.
  • What the board receives is exposure, plan cost, breakdown and trend, plus a reading of them, in one place.
  • The report is exported when it is needed, so the figures are the current picture and not last month's copy.
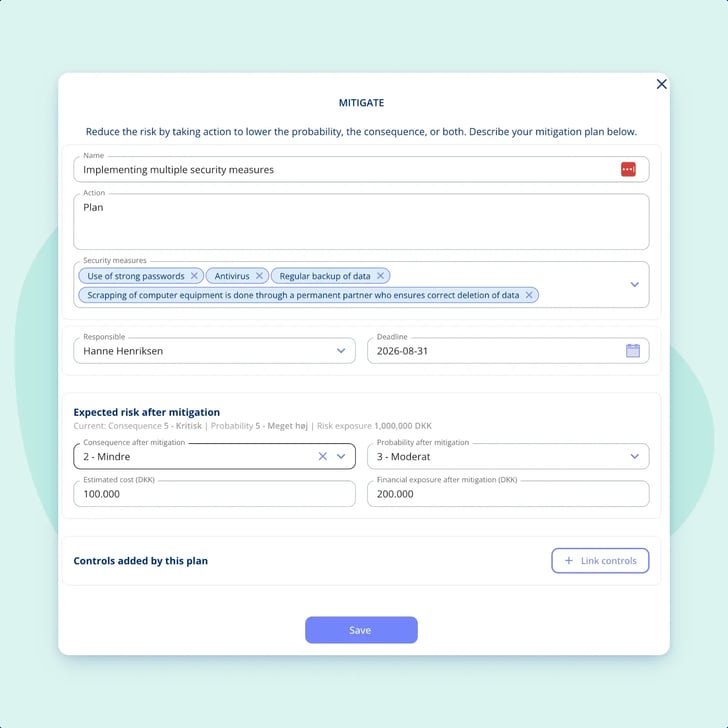
The mitigate dialogue on an assessed risk in .legal, holding the plan's name and actions, the security measures it relies on, a named responsible person and deadline, and the consequence and probability expected afterwards beside the plan's estimated cost and the exposure left once it is done

Risk reporting to the board Exposure, and what it costs to bring it down

Three financial figures run through the module, and the report puts them next to each other. That is the trade-off a board is actually asked to approve.
  • Risk exposure on the assessment: the estimated loss if the risk materialises.
  • Expected exposure after mitigation, set on the plan, so you can see what the plan buys.
  • The plan's own estimated cost, so the spend and the saving are compared in the same unit.
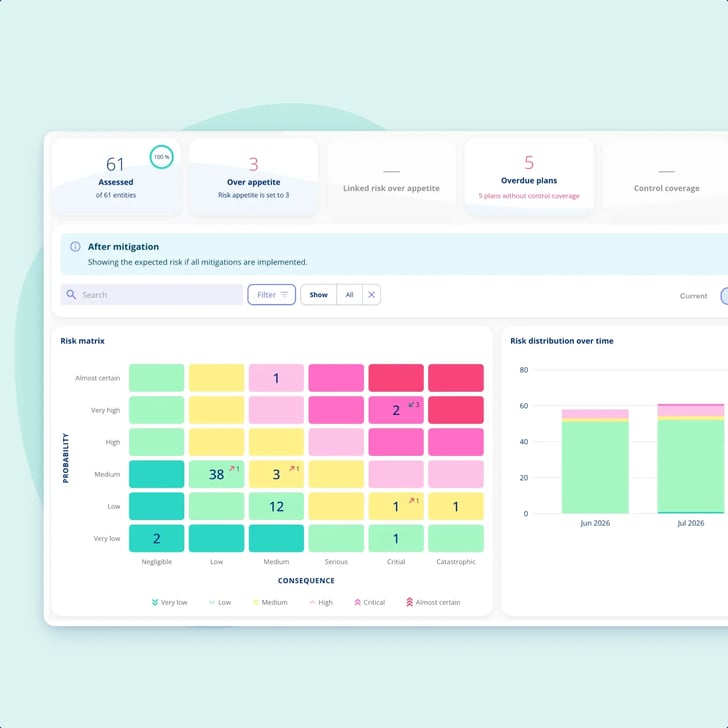
The governance overview for a risk area in .legal switched to show the expected risk if every mitigation were implemented: 61 of 61 entities assessed, three above an appetite of 3, five overdue plans, the entity matrix and the risk distribution over time

Risk reporting to the board The layer the report sits on

Beneath the management report is the governance overview, for whoever is responsible for a risk area. That is where the numbers in the report are made, and where they get worked.

  • A matrix of how many entities fall into each combination of consequence and probability, with entities over appetite, linked risks over appetite and overdue mitigation plans as key figures.
  • A switch to what the picture would look like if every mitigation plan were completed, which answers whether the plan is enough.
  • A switch to any past point in time, so "what did we know in June" is a view rather than an excavation.
Illustration contrasting two objects: a low board of small operational tiles beside a taller upright report panel carrying a bar chart, a trend line and a comment bubble

Risk reporting to the board What this is not

The platform also has a Compliance Dashboard, which has been there since 2024, and it is a different object from the management report. Worth being plain about, because the two get confused.

  • The dashboard is operational: counts of activities, assets, vendors and tasks, documentation progress, a monthly task graph, incidents by severity, and only the risks scored high or very high. No appetite, no exposure, no trend against a target.
  • The management report is risk. It does not roll up framework progress, control completion, policy acknowledgements, the record of processing activities or vendor audit scores.
  • So a board risk picture comes out of the platform. A board compliance status is still assembled outside it, and we would rather tell you that now than let you find out later.
.legal in practice

Features for risk reporting to the board

The management report (add-on)

One report across every risk area, measured against your global risk appetite: entities assessed, risks above appetite, exposure and plan cost. Part of the Enterprise Risk Management add-on.

Export with your own comment

The report exports, and the person exporting it inserts a comment as part of the export. The board gets the figures and the risk owner's framing in one artefact.

Financial exposure end to end

The estimated loss if a risk materialises, the expected exposure once a plan is complete, and the plan's own estimated cost. Three figures, one decision.

Breakdown by risk area

See which area the exposure comes from, so a board meeting goes straight to the two areas under pressure instead of touring all of them.

Governance overview for the area owner

The layer beneath the report: a matrix of how many entities sit in each combination of consequence and probability, entities over appetite, linked risks over appetite and overdue mitigation plans.

Simulation and any past point in time

Switch to what the picture would look like if every mitigation plan were completed, or back to a past point in time to see exactly how things looked then.

.legal compliance platform

Report risk to the board with...

Do you need to give the board a risk picture it can act on? We recommend the following module for that task.

Our Customers

+400

companies

+10.000

users

+79.000

contracts

+14.000

processing activities

Bech Bruun

Bech-Bruun

Mikkel Friis Rossa (Partner)

.legal's team has consistently demonstrated a commitment to innovation while being responsive to the needs of our mutual clients.

Rasmus-boutrup-fenerum

Fenerum

Rasmus Boutrup (Financial Controller)

Case Study
With .legal, we've gained a simpler and more manageable solution that better suits our needs
Michael Berner 1

Lægeforeningen

Michael Berner (Lawyer)

.legal has been the right choice for us. .legal are professional and welcoming with skilled employees.
Nanna Rodian Christensen

Molecule Consultancy

Nanna Rodian Christensen (HR & Operational Manager)

Case Study
Firstly, it means that not all the work is in one place (me), and secondly, that the understanding of GDPR is implemented throughout the organisation.
ulrikdueholmbeckmann

Plum Safety

Ulrik Dueholm Beckmann (QC, CM og ESG Lead)

Case Study
From .legal, we experience an incredibly high degree of flexibility and willingness to adapt features to our local needs.
Bech Bruun

Bech-Bruun

Mikkel Friis Rossa (Partner)

.legal's team has consistently demonstrated a commitment to innovation while being responsive to the needs of our mutual clients.

Rasmus-boutrup-fenerum

Fenerum

Rasmus Boutrup (Financial Controller)

Case Study
With .legal, we've gained a simpler and more manageable solution that better suits our needs
Michael Berner 1

Lægeforeningen

Michael Berner (Lawyer)

.legal has been the right choice for us. .legal are professional and welcoming with skilled employees.
Nanna Rodian Christensen

Molecule Consultancy

Nanna Rodian Christensen (HR & Operational Manager)

Case Study
Firstly, it means that not all the work is in one place (me), and secondly, that the understanding of GDPR is implemented throughout the organisation.
ulrikdueholmbeckmann

Plum Safety

Ulrik Dueholm Beckmann (QC, CM og ESG Lead)

Case Study
From .legal, we experience an incredibly high degree of flexibility and willingness to adapt features to our local needs.
julie-oxenvad-novicell

Novicell

Julie Oxenvad (Legal Consultant)

Case Study
We are satisfied with the switch to .legal – it has strengthened our compliance work, made processes easier to manage and more transparent, and improved cross-team collaboration
Tinna Schultz

Min By Media

Tinna Schultz (HR Manager)

Case Study
It just works! It is so easy and user-friendly, and the overview of processing activities is brilliant.
ansat_Kaspar_Rochholz_005

DMJX

Kaspar Rochholz (GDPR Coordinator)

Case Study
.legal has really understood what it means to create a user-friendly and efficient solution. Privacy is an attractive product compared to price and functionality.
Profile-picture1

Axel Kaufmann ApS

Julie Lundkvist Andreasen (Lawyer and Head of Costumer Service)

Case Study
.legal continuously update the platform to ensure their customers always remain compliant. In our view, any other choice would be a downgrade.

NRGi

Mette Mühlendorph (Compliance Specialist)

Case Study
The implementation of .legal has made a difference in the way we handle compliance. The system has created structure and overview, which has had concrete benefits.
julie-oxenvad-novicell

Novicell

Julie Oxenvad (Legal Consultant)

Case Study
We are satisfied with the switch to .legal – it has strengthened our compliance work, made processes easier to manage and more transparent, and improved cross-team collaboration
Tinna Schultz

Min By Media

Tinna Schultz (HR Manager)

Case Study
It just works! It is so easy and user-friendly, and the overview of processing activities is brilliant.
ansat_Kaspar_Rochholz_005

DMJX

Kaspar Rochholz (GDPR Coordinator)

Case Study
.legal has really understood what it means to create a user-friendly and efficient solution. Privacy is an attractive product compared to price and functionality.
Profile-picture1

Axel Kaufmann ApS

Julie Lundkvist Andreasen (Lawyer and Head of Costumer Service)

Case Study
.legal continuously update the platform to ensure their customers always remain compliant. In our view, any other choice would be a downgrade.

NRGi

Mette Mühlendorph (Compliance Specialist)

Case Study
The implementation of .legal has made a difference in the way we handle compliance. The system has created structure and overview, which has had concrete benefits.
Use cases

Find the job you need done

Every use case is a real piece of compliance work, told the way it actually runs in the platform. Filter by who you are, what you work with, and which frameworks you answer to.

Book demo

6 use cases

Frequently Asked Questions about risk reporting to the board

What is the management report in .legal?

A report that brings your risk numbers together across every risk area and measures them against one global risk appetite. It shows how many entities have been assessed, how many risks currently sit above appetite, financial exposure now and once the open mitigation plans are completed, what those plans are expected to cost, a breakdown showing which area the pressure comes from, and a trend over time. It arrived with the Enterprise Risk Management add-on in August 2026.

Is this a compliance status for the board, or a risk status?

A risk status, and the difference matters. The report reads risk data: areas, entities, appetite, exposure and mitigation plans. It does not aggregate framework progress, control completion, policy acknowledgements, the record of processing activities or vendor audit scores, so a full compliance picture for a board is still put together outside the platform.

Manage compliance across a group of companies

Can the report be taken into a board pack?

Yes. The report exports, and the person exporting it can insert a comment as part of the export, so the figures arrive with the risk owner's own framing on them instead of in a separate email. We deliberately do not name a file format here, because none is documented. Ask about it on a demo.

Is this the same thing as the Compliance Dashboard?

No. The Compliance Dashboard has been in the platform since 2024 and is the operational layer: counts of processing activities, assets, vendors and tasks, documentation progress, a monthly task graph, incidents by severity, the latest audit submissions and the risks that scored high or very high. It has no risk appetite, no financial exposure and no trend against a target, so it is not a management report and we do not present it as one.

Where do the figures come from?

Your own assessments. Consequence and probability are stated by the person doing the assessment, each with a justification, and the risk level is looked up in a matrix you configure yourself, cell by cell if you want. The exposure figures are your estimates too. The platform does the arithmetic and keeps the record. It does not decide what your risks are.

How current are the numbers?

The report shows the picture as it stands when you open it, and you export it when you need it, typically ahead of a board meeting. So it is pulled on demand rather than arriving by itself. If you need an older picture, the area owner can switch to any past point in time and see exactly how things looked then.

Do we need an add-on for this?

Yes. The management report and the governance overview beneath it came with Enterprise Risk Management, which is a paid add-on. Customers who do not have it carry on with the risk module they already use, and that module has no risk report of its own.

Does the board need logins to see this?

No. The report is exported and handed on, so nobody has to open the platform to read it. Users are unlimited if you do want a board member or an internal auditor to have access, but the report is built to be received rather than logged into.

What an internal audit involves

Who approves a mitigation plan before the money is spent?

A plan moves from proposed to approved to completed, and it carries an estimated cost and the expected exposure once it is done, which is what the decision actually needs. The module is built around three levels of responsibility: the people assessing, the person responsible for a risk area, and management. How tightly approval should be locked down is worth raising on a demo, because that is where organisations differ most.

What management is accountable for under NIS2

Still unsure?

Ask Johannes directly, he runs most demos personally

Book him here
+400 companies use .legal
Region Sjælland
Aarhus Universitet
aj_vaccines_logo
Realdania
Right People
IO Gates
PLO
Finans Danmark
geia-food
Evida
Klasselotteriet
NRGI1
BLUE WATER SHIPPING
Karnov
Ingvard Christensen
VP Securities
AH Industries
Lægeforeningen
InMobile
AK Nygart
DEIF
DMJX
Axel logo
qUINT Logo
KAUFMANN (1)
SMILfonden-logo
kurhotel_skodsborg
nemlig.com
Molecule Consultancy
Novicell