
ADD-ON · ENTERPRISE RISK MANAGEMENT
Different scales. One report.
If every risk area has its own matrix and its own appetite, how do you report across them? You don't add the scales together. You add the exceedances together, measured against one global appetite, and management gets something they can decide on.
 Watch the video

.png?width=68&height=52&name=bws_shipping_rgb%20-%20Kopi%20(2).png)






.jpeg?width=131&height=26&name=right_people_logo%20(1).jpeg)

.jpg?width=58&height=26&name=Praktiserende%20L%C3%A6gers%20Organisation%20(1).jpg)
.jpg?width=108&height=26&name=finans%20danmark%20(1).jpg)


.jpg?width=89&height=26&name=klasselotteri%20(1).jpg)

-1.png?width=34&height=26&name=bws_shipping_rgb%20-%20Kopi%20(2)-1.png)



.jpeg?width=135&height=26&name=AH%20industries%20(1).jpeg)






.jpg?width=225&height=26&name=KAUFMANN%20(1).jpg)




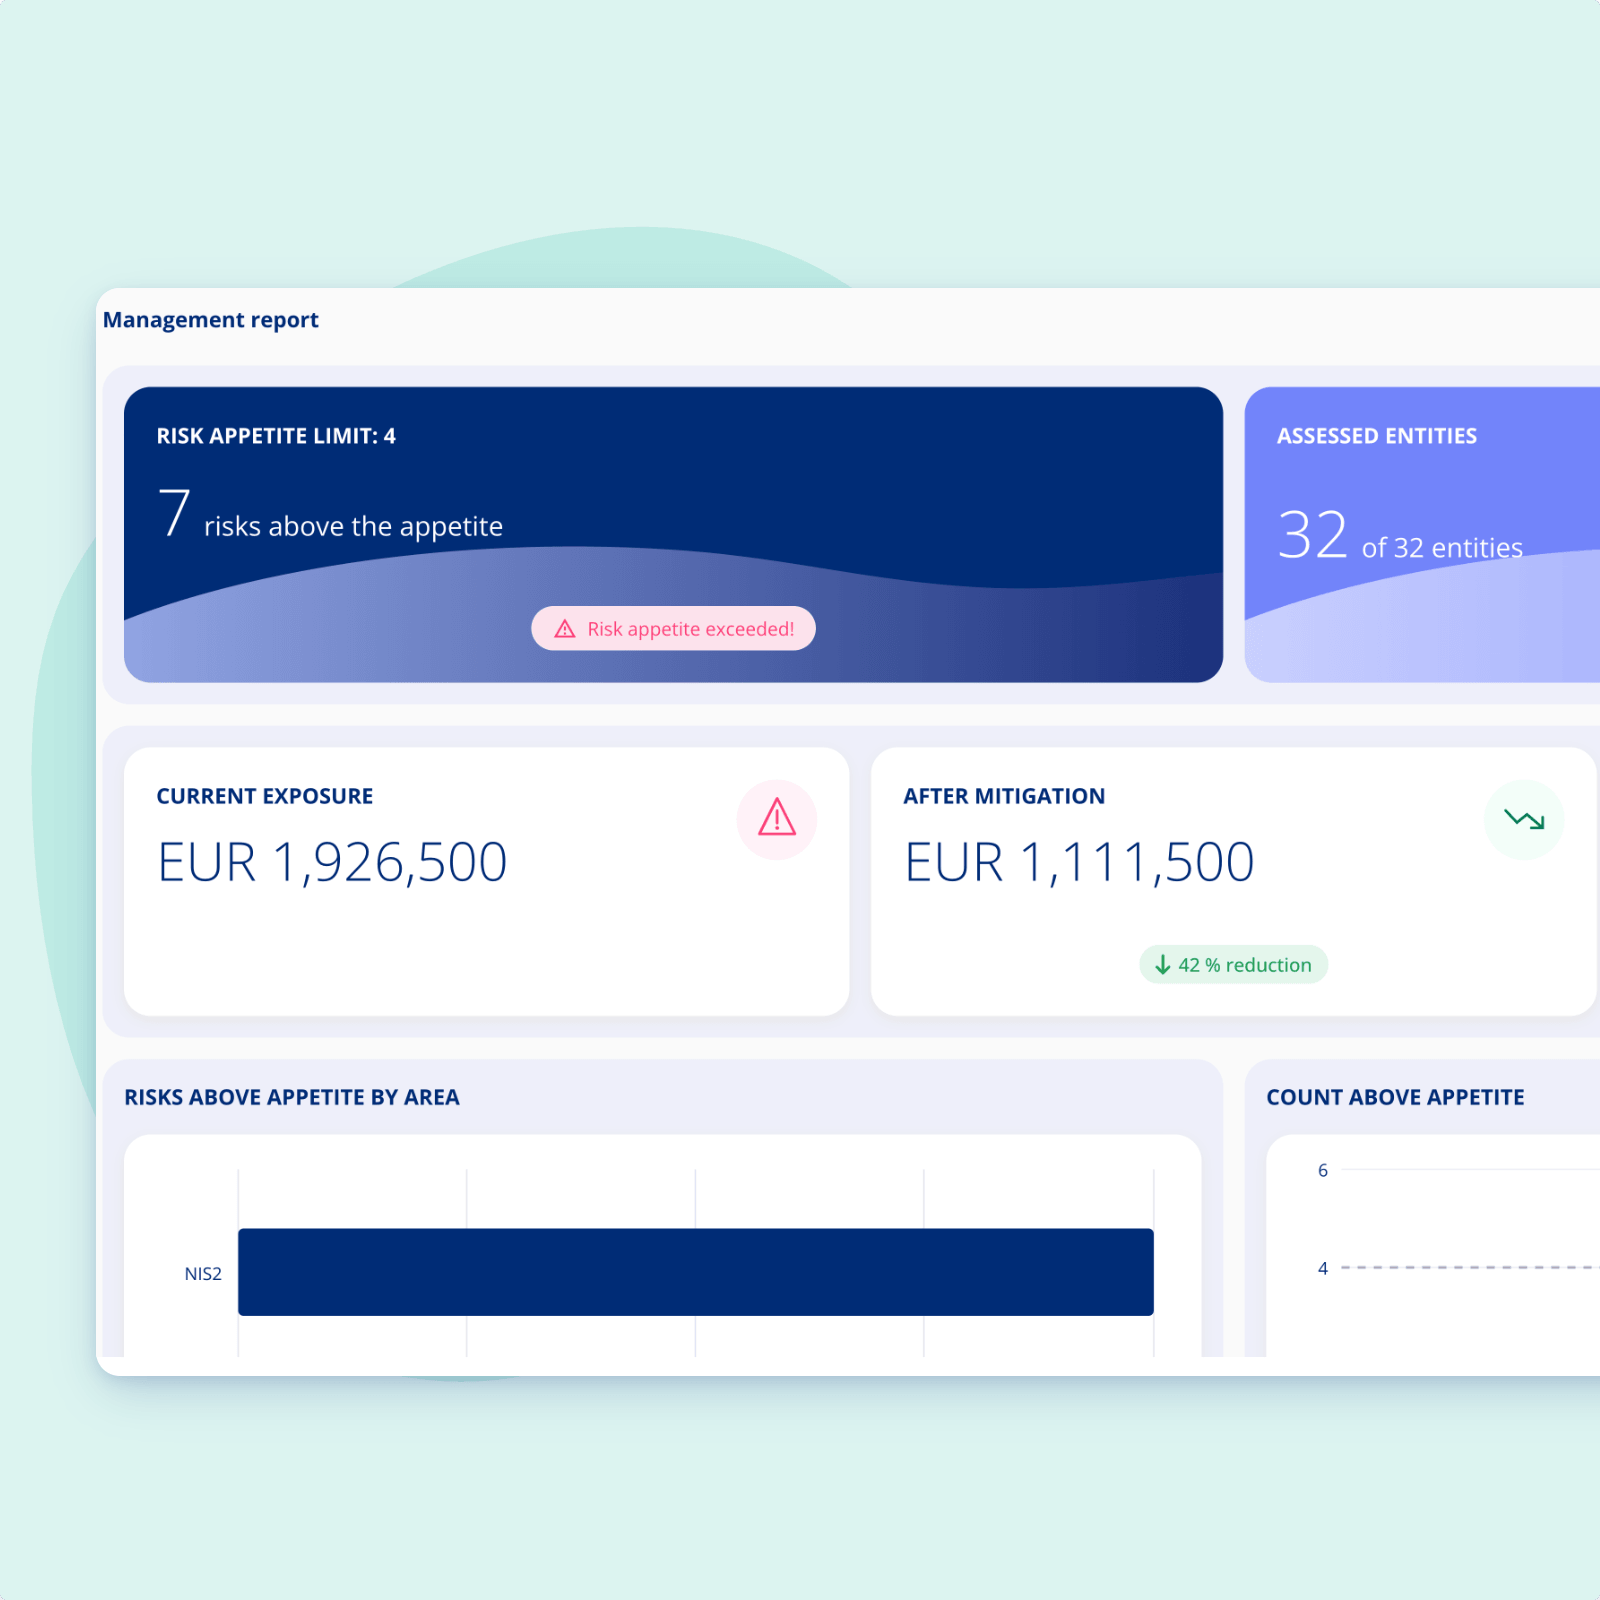
Management doesn't need your averages
A five in one area isn't a five in another, so an average across areas tells you nothing at all. What a board needs is how many risks sit above the appetite you set yourselves, where they sit, what they cost, and whether it's moving the right way.
-
Exceedances travel, scales don't: Being over appetite means the same thing in every area, whatever the underlying scale looks like.
-
A snapshot rarely tells you much: One number on one day is a status update. A trend is an argument.
-
Decisions need a threshold: Without a global appetite there's nothing to say when this stops being operational.
One decision paper across every area
A short look at how different scales end up in the same report.

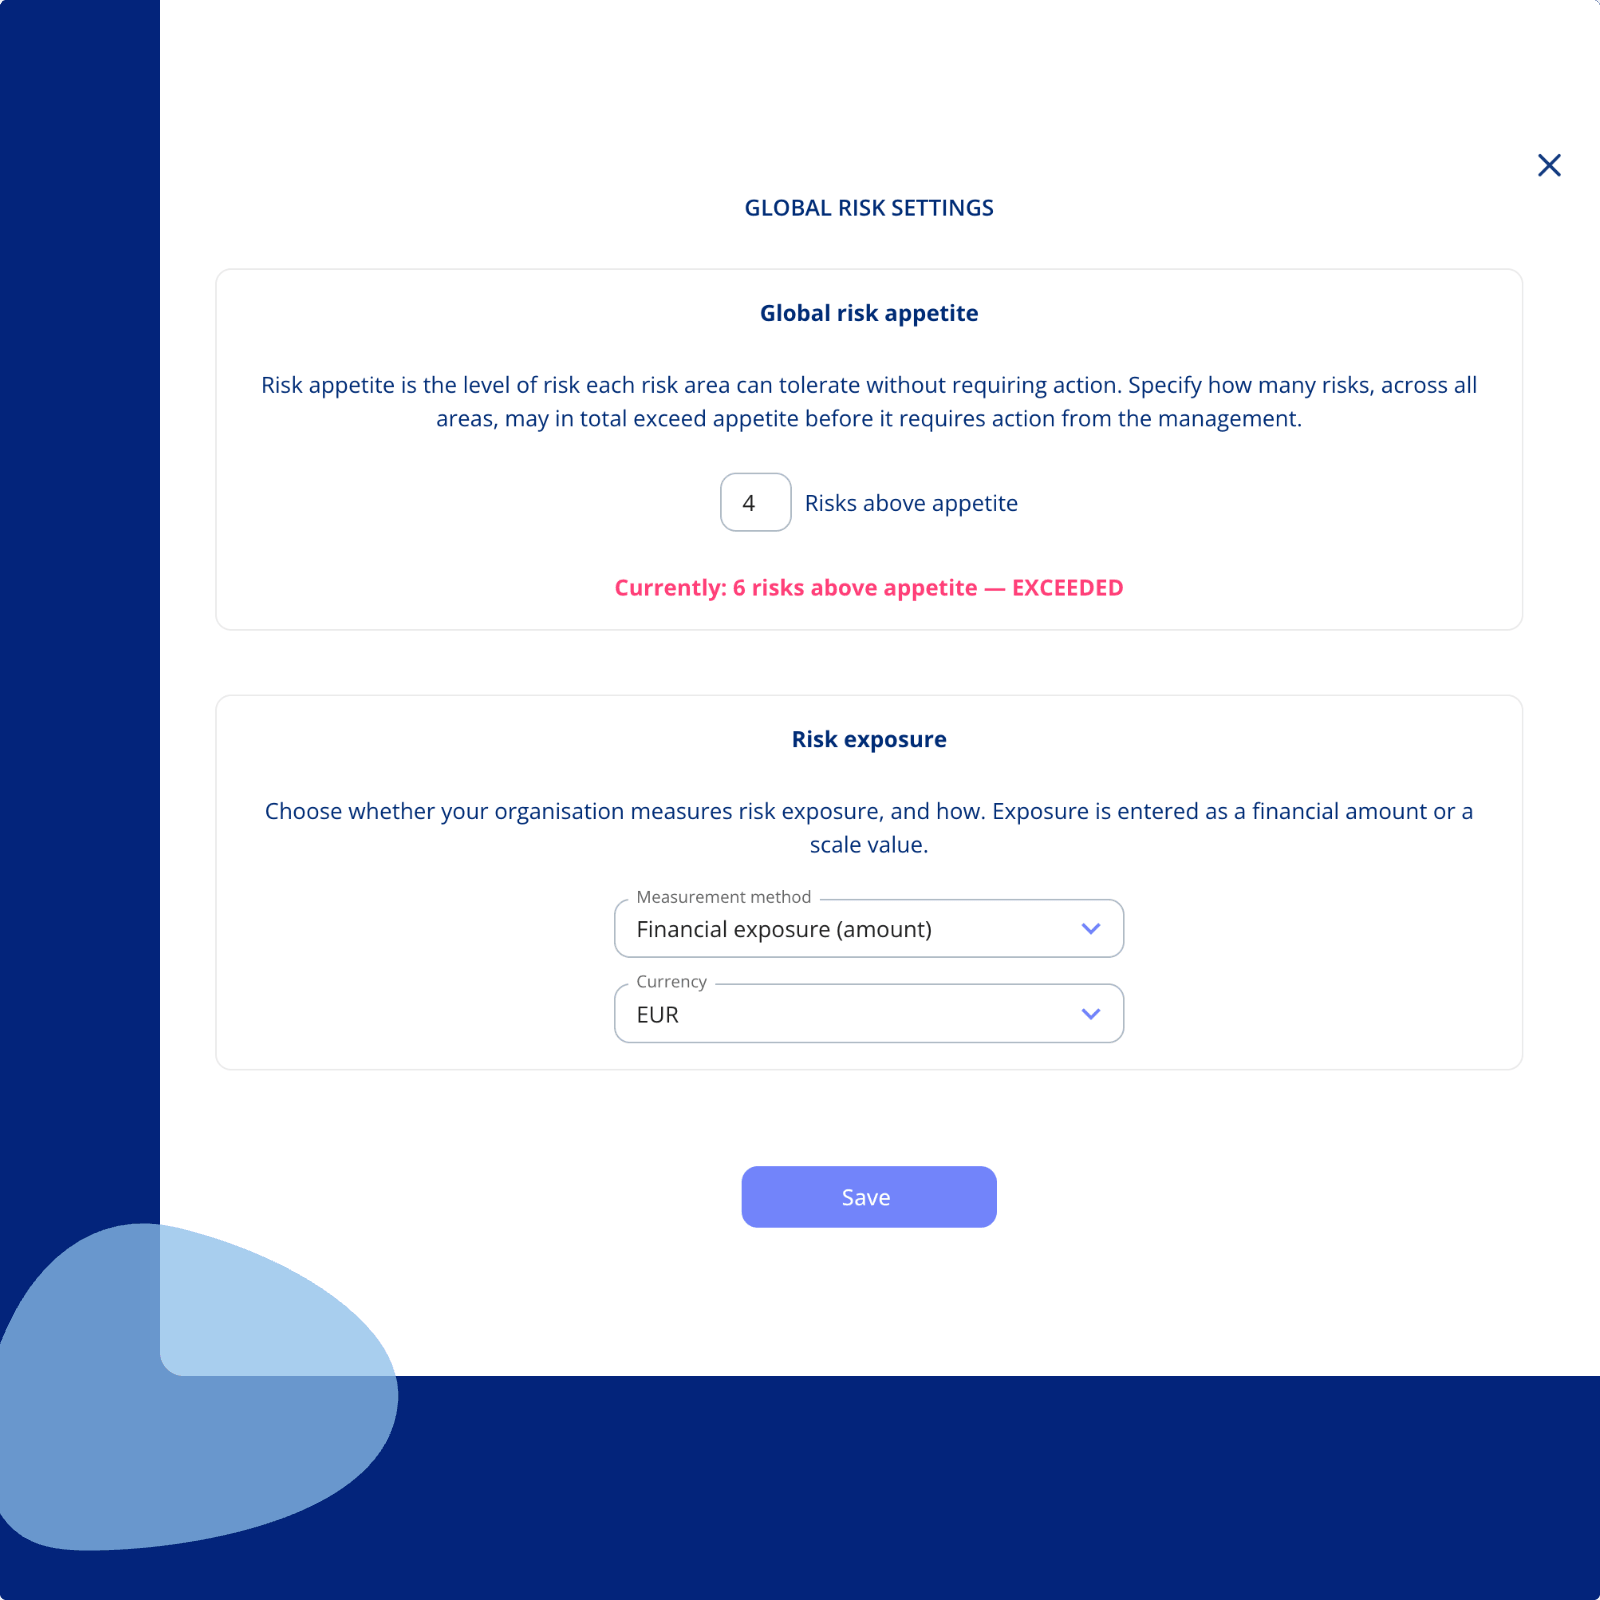
Set one global risk appetite
Alongside the appetite in each area, you define an overall one for the organisation.
-
A total, not an average: How many risks across all areas may sit above appetite before management has to act.
-
A clear trigger: When the total is breached, it's no longer a question of judgement about whether to escalate.
-
Everything measured against it: The management report reads the whole organisation against this one number.
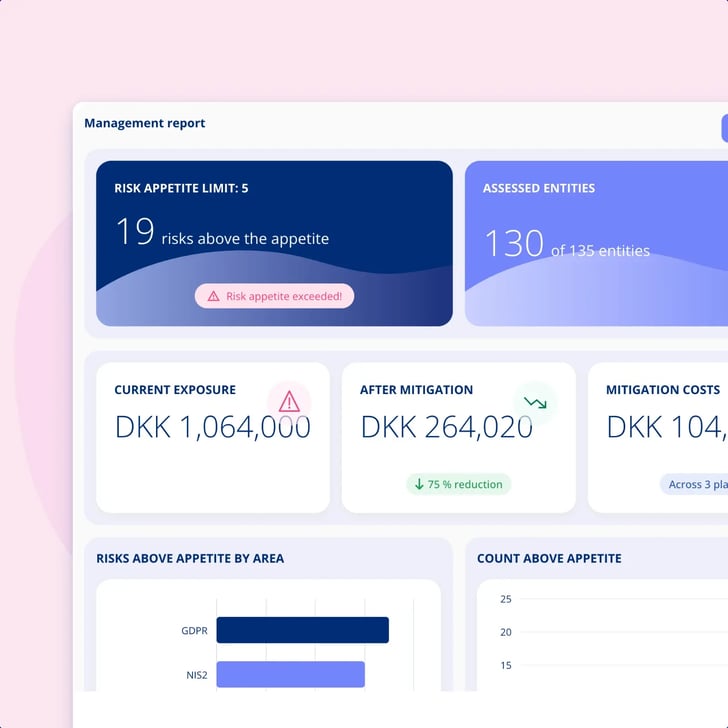
A report that works across different scales
Areas keep their own matrices. The report reads what they have in common.
-
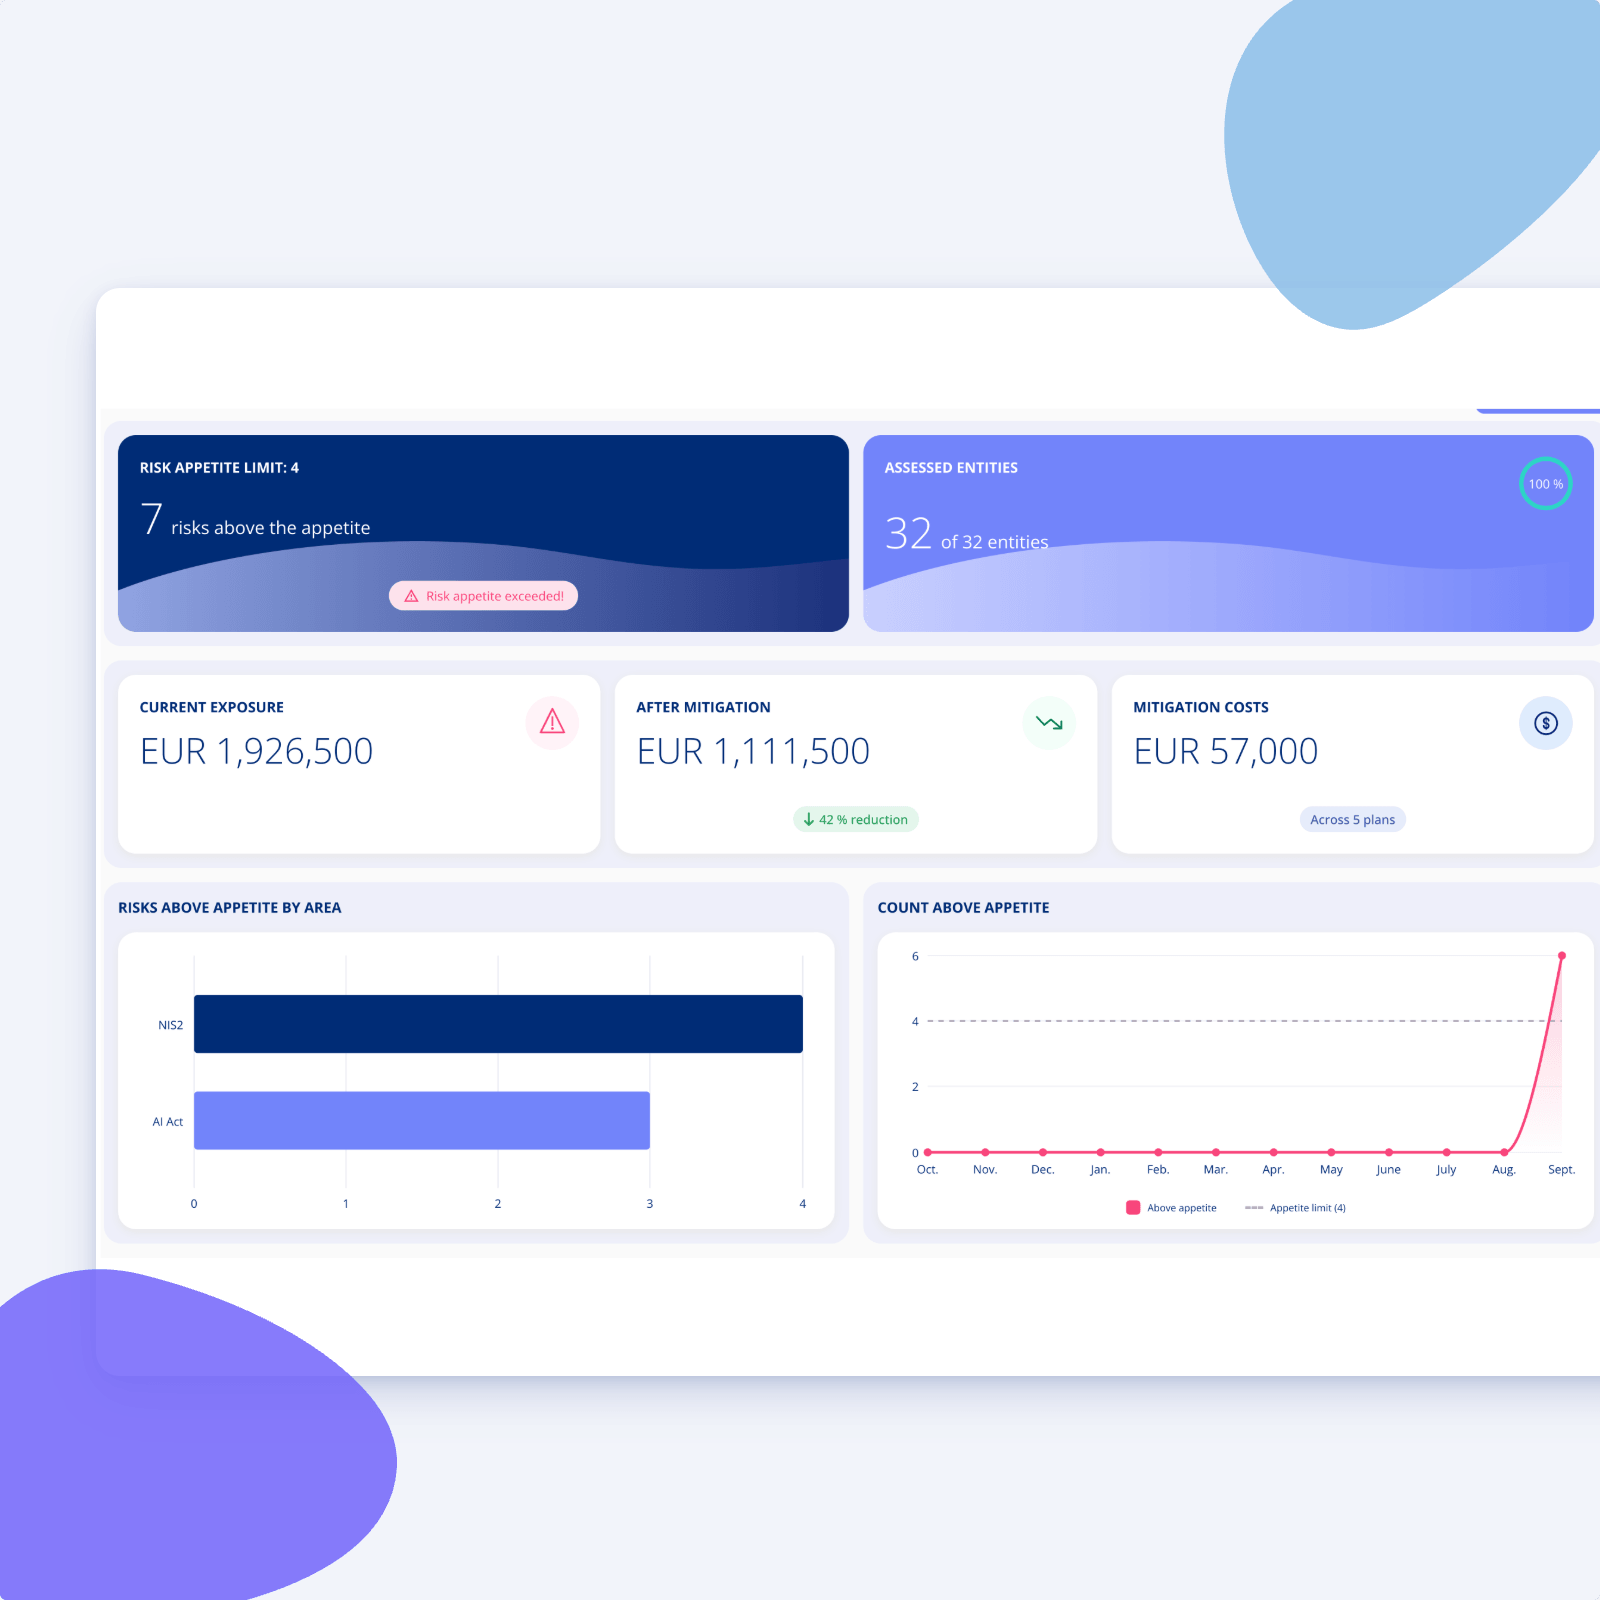
Entities assessed: How much of your scope has actually been through an assessment.
-
Risks above appetite: The current total, measured against the global appetite.
-
No forced translation: Nobody has to normalise a three step scale against a six step one to make the numbers meet.
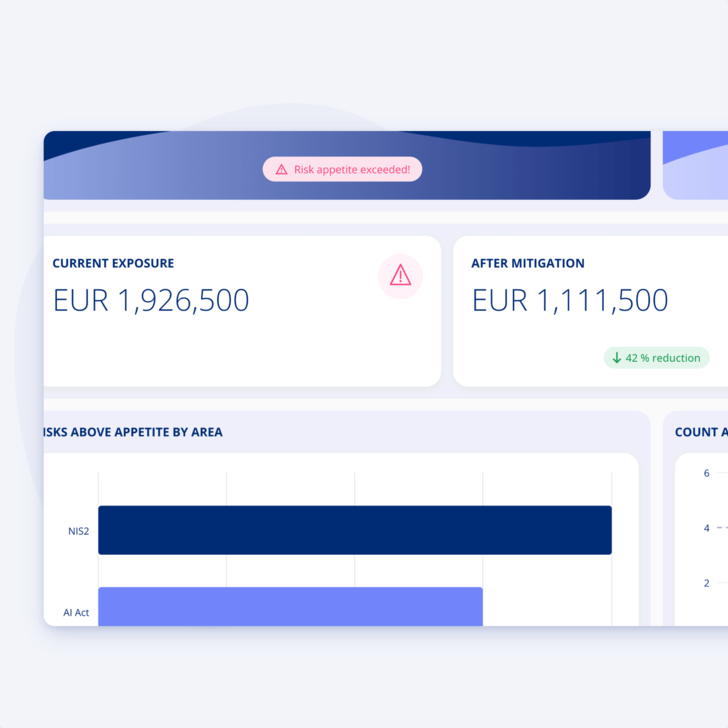
Financial exposure now and after your plans
Where you work with money, the report brings it together.
-
Exposure today: Total estimated exposure across every area.
-
Exposure after mitigation: What it would be once the open plans are completed.
-
What that costs: The estimated cost of the plans, next to the reduction they deliver.
Breakdown by area and trend over time
Two views that turn the report from a status update into a conversation.
-
Where the pressure comes from: A breakdown by area shows which domain is driving the numbers.
-
Direction of travel: A trend over time shows whether the picture is improving or getting worse.
-
Something to prioritise on: Together they make the next decision fairly obvious.
See it as it is, as it will be, or as it was
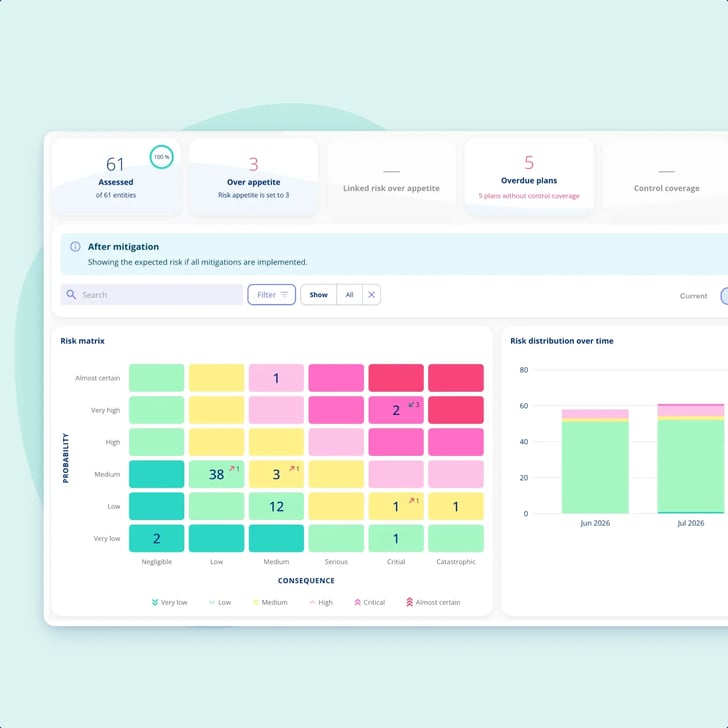
The area overview lets you switch the view.
-
Current: The picture as it stands today.
-
After mitigation: What it would look like if every open plan were completed.
-
Historic: Any past point in time, exactly as it looked then.

Getting You Started
Customer Support
-
You get a dedicated Customer Success Manager.
-
Personal onboarding to ensure a smooth start.
-
Support available Monday to Friday, 9 AM to 3 PM.

.legal compliance platform
Begin with Enterprise Risk Management today
-
Works alongside your existing frameworks
-
Free onboarding included
-
No commitment