
ADD-ON · ENTERPRISE RISK MANAGEMENT
See risk in context.
A process can look perfectly harmless on its own. But it runs on a system, the system is hosted by a supplier, and somewhere down that chain sits a risk you never assessed on the process itself. The relationship graph shows you how it all connects.
 Watch the video

.png?width=68&height=52&name=bws_shipping_rgb%20-%20Kopi%20(2).png)






.jpeg?width=131&height=26&name=right_people_logo%20(1).jpeg)

.jpg?width=58&height=26&name=Praktiserende%20L%C3%A6gers%20Organisation%20(1).jpg)
.jpg?width=108&height=26&name=finans%20danmark%20(1).jpg)


.jpg?width=89&height=26&name=klasselotteri%20(1).jpg)

-1.png?width=34&height=26&name=bws_shipping_rgb%20-%20Kopi%20(2)-1.png)



.jpeg?width=135&height=26&name=AH%20industries%20(1).jpeg)






.jpg?width=225&height=26&name=KAUFMANN%20(1).jpg)




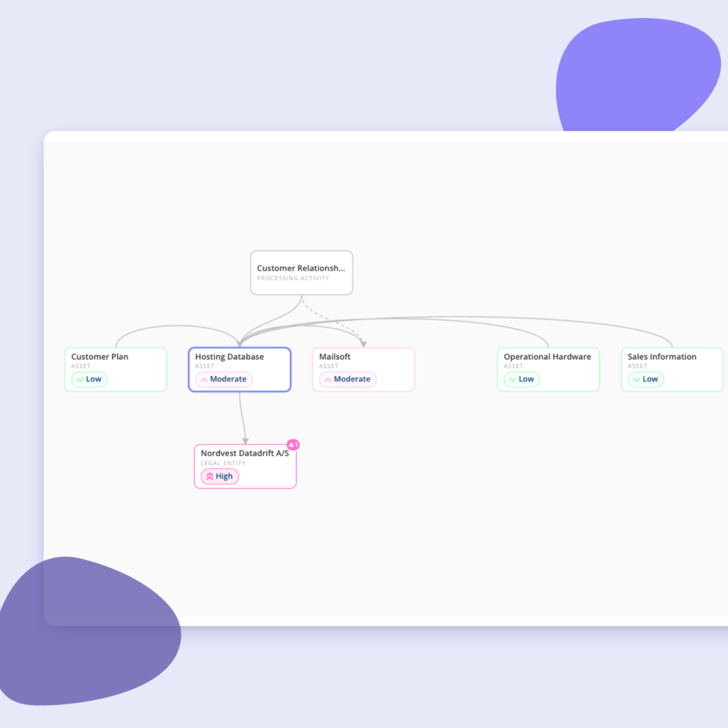
A spreadsheet has rows. Reality has connections.
Risk rarely sits in isolation. A processing activity depends on the assets behind it, and those assets depend on suppliers, who depend on someone else again. That chain is where inherited risk lives, and it's almost impossible to see in a list.
-
Low risk isn't always low risk: An entity can look fine while being surrounded by things that aren't.
-
Inheritance needs explaining: When something is flagged, you need to be able to trace why, not just that it was.
-
Insight has to lead somewhere: A graph is interesting. A graph that takes you to an action plan is useful.
How risk travels through the chain
A short look at connected entities and inherited risk.

.png?width=728&height=728&name=entity%20relationship%20graph%20-%20more%20levels%20(1).png)
See how your entities connect
The relationship graph shows an entity and everything attached to it.
-
Processes, assets and suppliers: See how a processing activity relates to the systems and suppliers behind it.
-
Follow the chain: Trace the connection outwards as far as you need to go.
-
Readable, not a spiderweb: Built to be understood in a meeting, not decoded afterwards.
.png?width=728&height=728&name=Risk%20link%20(1).png)
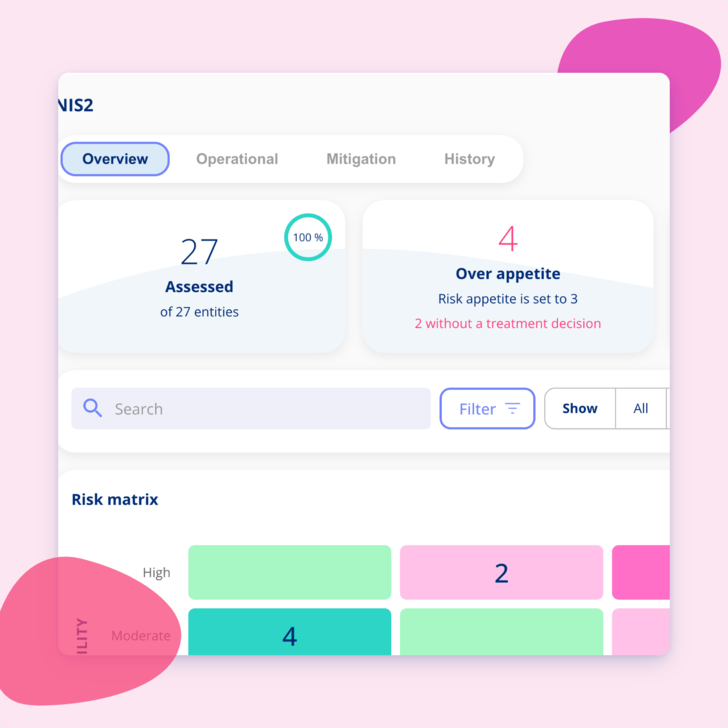
Understand where a risk was inherited from
When an entity picks up risk from elsewhere, the graph shows you the route.
-
Trace it back: See which connected entity is the actual source.
-
Explain it to others: Much easier to justify a rating when you can point at the chain rather than describe it.
-
Catch what a list would miss: Exposure that lives two steps away from the thing you're responsible for.
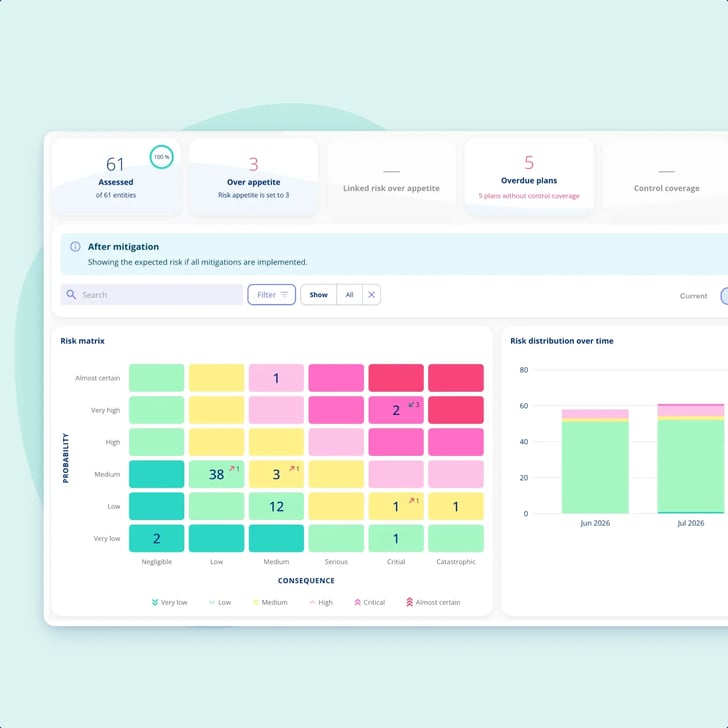
Linked risks above appetite, as a figure
The insight becomes a number you can act on.
-
In the area overview: Linked risks over appetite sits alongside entities over appetite and overdue plans.
-
A prioritisation signal: It tells you where to look first, rather than leaving it to whoever happens to open the graph.
-
Visible to the area owner: Anyone with overall responsibility for an area sees it as part of the standard picture.
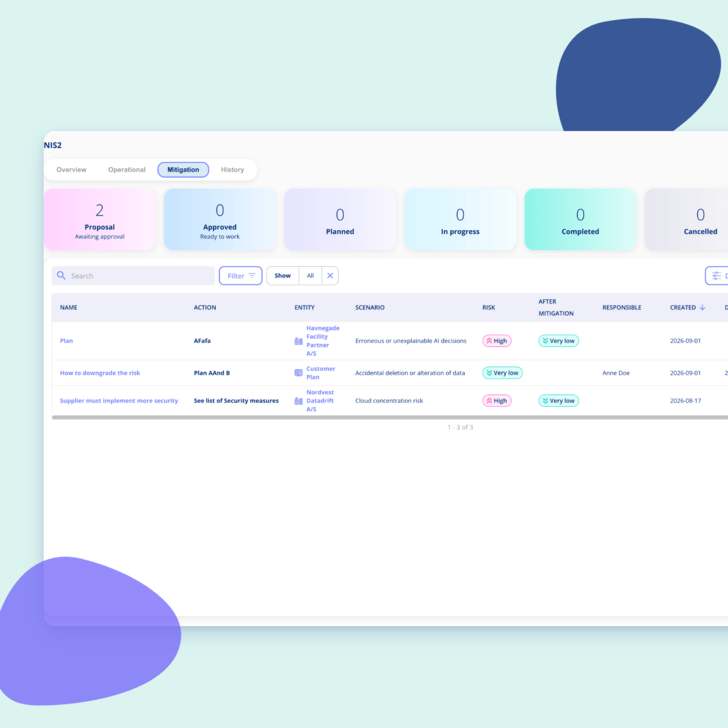
From the graph to the action plan
Insight is the first half. The second half is doing something.
-
Click through: Move from the graph to the specific entity and its assessment.
-
Treat it like any other risk: Accept, avoid or build a mitigation plan, from the same place.
-
Closes the loop: What you saw in the graph ends up as a task with an owner and a date.

Getting You Started
Customer Support
-
You get a dedicated Customer Success Manager.
-
Personal onboarding to ensure a smooth start.
-
Support available Monday to Friday, 9 AM to 3 PM.

.legal compliance platform
Begin with Enterprise Risk Management today
-
Works alongside your existing frameworks
-
Free onboarding included
-
No commitment